


Quick answer: Your SEO is working if impressions and unique ranking queries are rising, your pages are migrating up through position bands (21–50 → 11–20 → 4–10), and organic conversions are growing — even when raw clicks are flat.
Since AI Overviews now appear on more than 20% of Google searches and cut position-1 click-through rate by roughly 58%, falling clicks alone no longer prove your SEO has failed. Check impressions first. If impressions hold and clicks drop, you have a click-capture problem, not a ranking problem.
Most teams check the wrong number first.
They open Google Analytics, see organic sessions down 20% year over year, and conclude the SEO is broken.
Sometimes it is.
But in 2026, a traffic drop is just as likely to mean your content is being read inside an AI Overview instead of on your site. SparkToro’s analysis of Similarweb clickstream data found that zero-click searches reached 68% of US Google queries in early 2026 — the fastest acceleration in a decade, driven largely by AI Overviews.
Ahrefs puts the damage more precisely. Their updated study of 300,000 keywords found AI Overviews now reduce position-1 clicks by 58%, up from 34.5% eight months earlier.
So the old test — “is traffic up?” — now produces false negatives constantly.
You need a layered test instead. One that separates visibility from clicks, and clicks from business outcomes.
Here’s what actually determines whether your SEO is working:
- Visibility: Are you appearing for more queries, in better positions, across more surfaces
- Capture: Of the people who see you, how many still click
- Value: Of the people who click, how many do something worth money
- Demand: Is your brand getting searched and mentioned more often than last quarter
Miss any one layer and you’ll misdiagnose the whole thing.
Throughout this guide, we’ll follow one example: Fernwell, an online plant care store doing about 18,000 organic sessions a month, with a blog that drives most of its top-of-funnel traffic. Fernwell’s clicks dropped 31% in six months. Its SEO was, in fact, working.
Here’s how you’d prove that.
Setting up the layers visually helps before we get into steps. Like this:
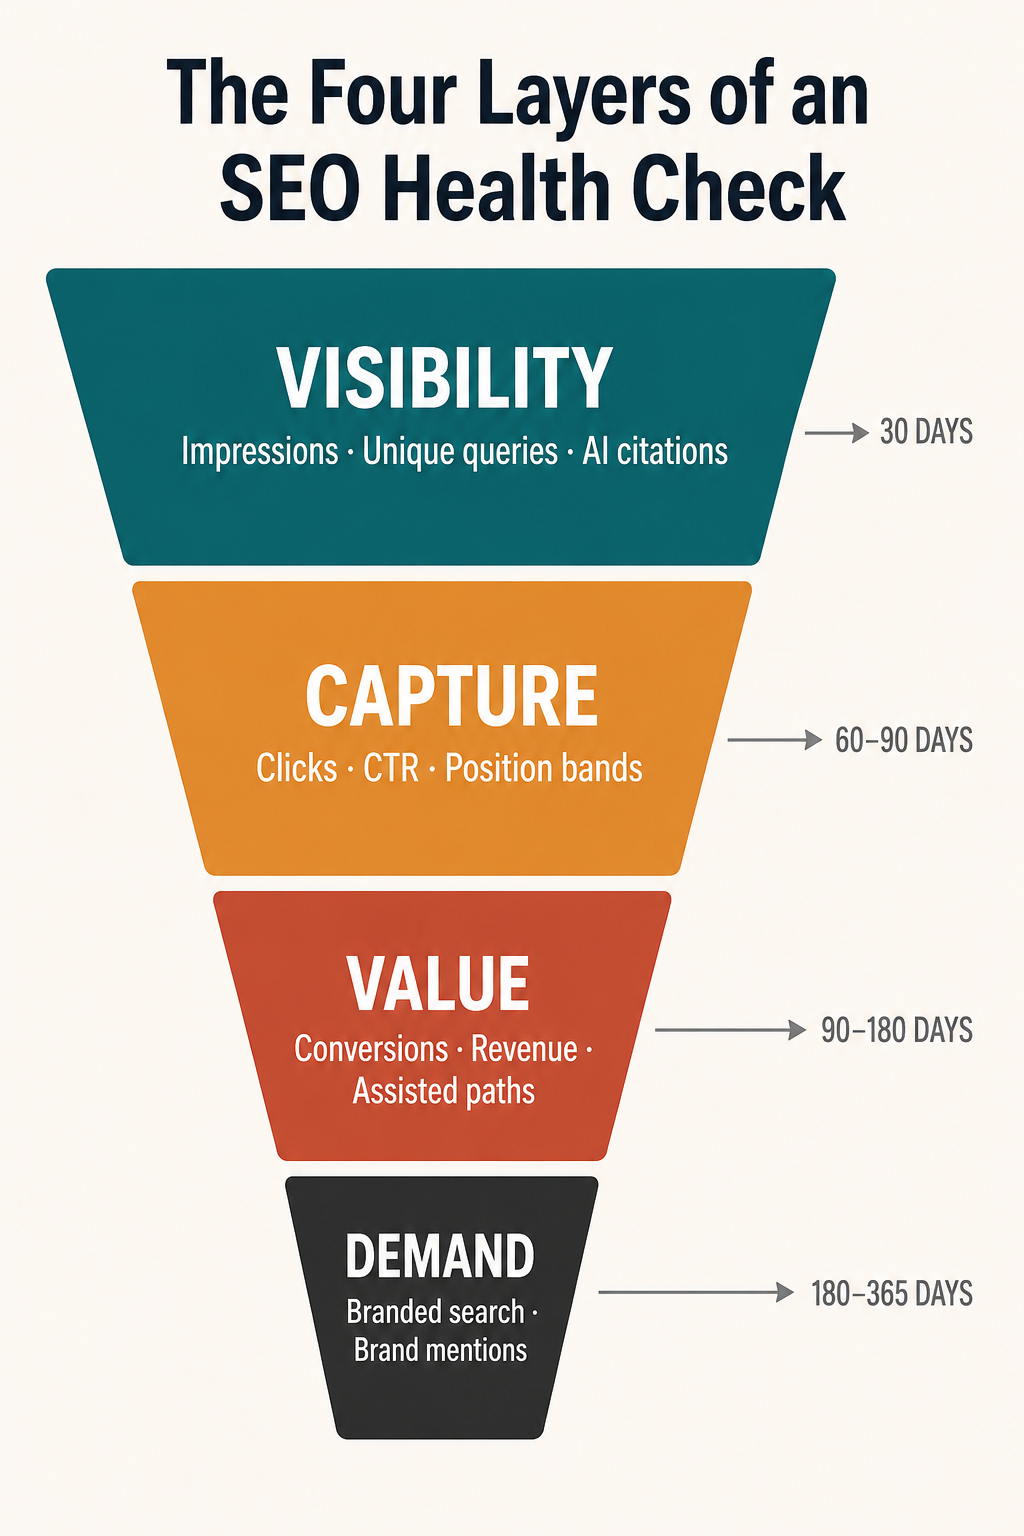
Notice the time labels on the right. Layer one moves in weeks. Layer four moves in quarters. Judging a three-month-old campaign on layer four is how good SEO gets killed early.
Note
Every metric below needs a dated baseline to be readable. If you don’t have one yet, start step 1 today and come back in 30 days — a number without a comparison point tells you nothing.
1. Set a Baseline Before You Judge Anything
A baseline is a dated snapshot of your search performance that every future number gets compared against. Without it, you’re guessing at direction from a single data point.
Most teams skip this. Then they argue for six months about whether a decline started before or after the redesign.
What to snapshot on day zero
Pull these from Google Search Console and store them in a spreadsheet, not a screenshot.
Capture the following for a full 28-day window:
- Total impressions and total clicks: the two headline numbers everything else explains
- Unique query count: how many distinct search terms you appeared for at all
- Position band distribution: how many queries sit in positions 1–3, 4–10, 11–20, 21–50
- Branded vs non-branded split: filter queries containing your brand name, then invert it
- Top 20 landing pages by clicks: your revenue-adjacent pages, tracked individually
Then repeat the exact same pull every 28 days.
Why 28 days and not a calendar month?
Because months have different numbers of weekends, and search volume is weekly-cyclical. A 28-day window always contains exactly four of each weekday.
Keep an annotation log
An annotation log is a running list of every change you made and when — content updates, redirects, template changes, Google algorithm updates, PR placements.
It costs you two minutes a week.
It’s also the only thing that turns “traffic dropped in March” into “traffic dropped four days after we consolidated 40 category pages.”
Tip
Log Google’s confirmed core and spam updates in the same sheet — Ahrefs maintains a free algorithm update timeline you can copy dates from. Roughly a third of unexplained movement lines up with a dated update you’d otherwise forget about.
2. Run the Impressions-vs-Clicks Diagnostic
This is the single highest-value check in the entire article, and almost nobody runs it.
Plot impressions and clicks on the same chart in Search Console. Then read the relationship between the two lines, not either line alone.
Four patterns are possible. Each one means something completely different.
Here’s how they compare:
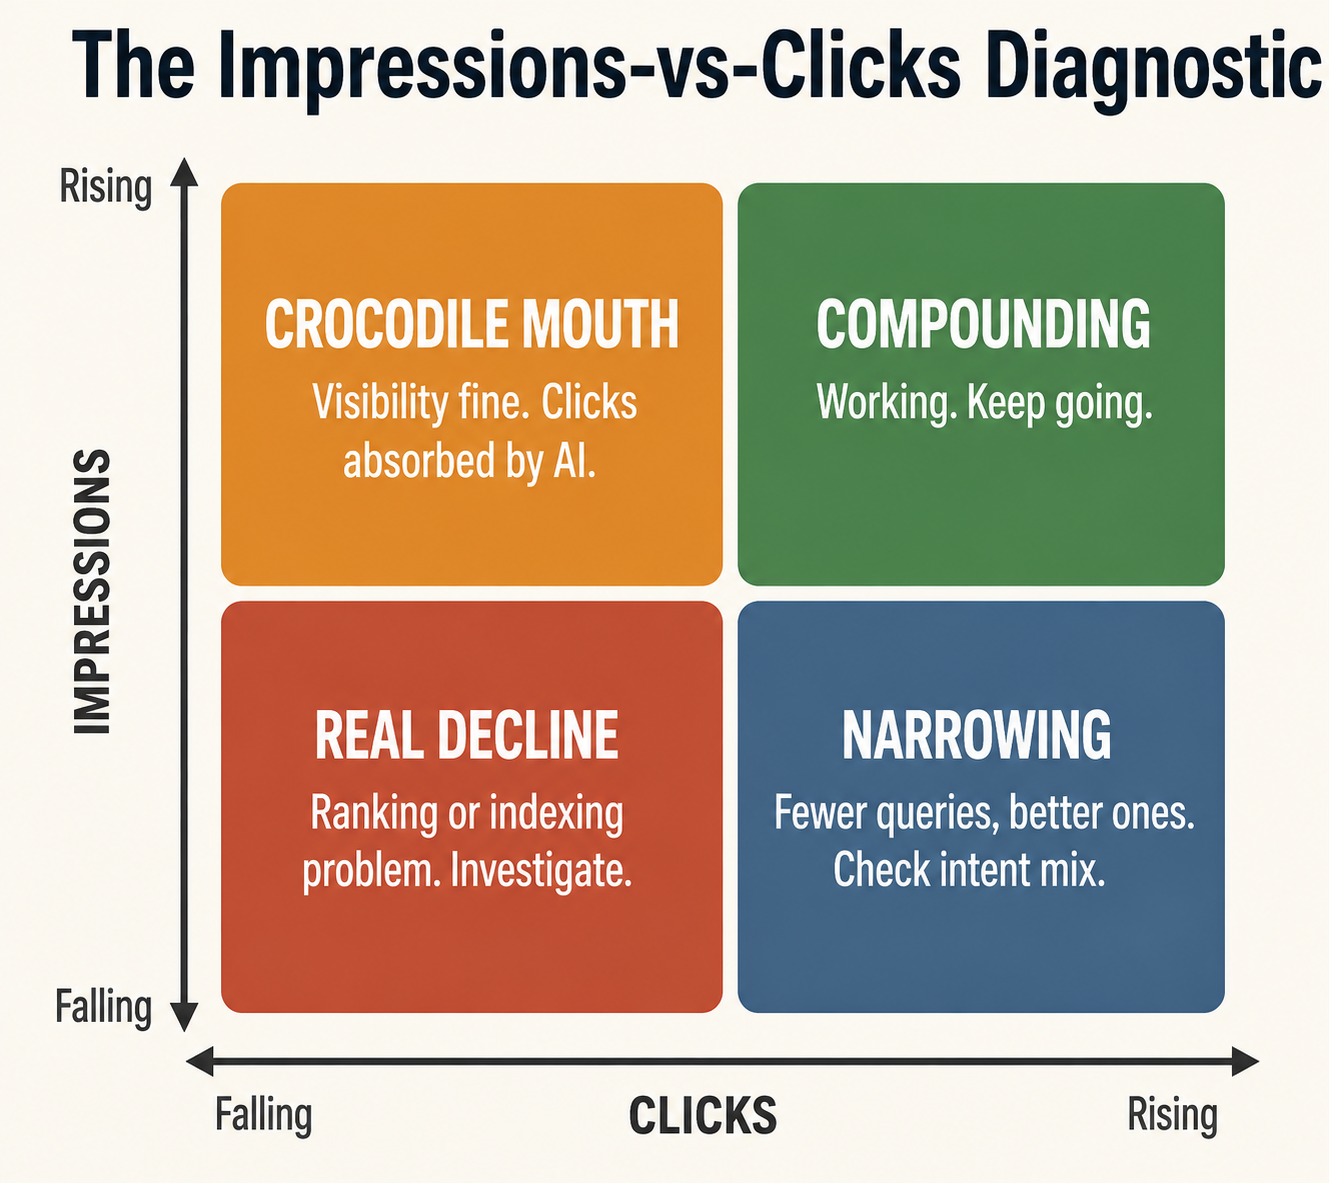
Three of those four quadrants get misread as failure. Only one of them actually is.
The crocodile mouth
The crocodile mouth is a chart pattern where impressions hold flat or climb while clicks fall away beneath them, opening a widening gap between the two lines.
It looks like a jaw opening.
Ahrefs describes it as the signature of an AI Overview absorbing your clicks rather than a ranking problem. Your page still ranks. Google still shows it. The searcher just got their answer above the blue links.
This is exactly what happened to Fernwell.
Its guide on yellowing monstera leaves held a stable position 3 for a 2,400-searches-a-month query. Impressions went up 9% over six months. Clicks fell 44%.
Nothing about that page got worse. The SERP changed around it.
How to run the check
Open Search Console, go to the “Performance” report, and set the date range to “Compare” → last 6 months vs previous period.
Then do this:
- Tick both “Total clicks” and “Total impressions” so both lines render
- Switch to the “Pages” tab and sort by click difference, ascending
- For each losing page, add the impressions column and check whether impressions fell too
Pages where clicks fell but impressions didn’t are crocodile-mouth pages.
Pages where both fell are your real problem list.
Here’s what the pattern looks like in a live Search Console account:
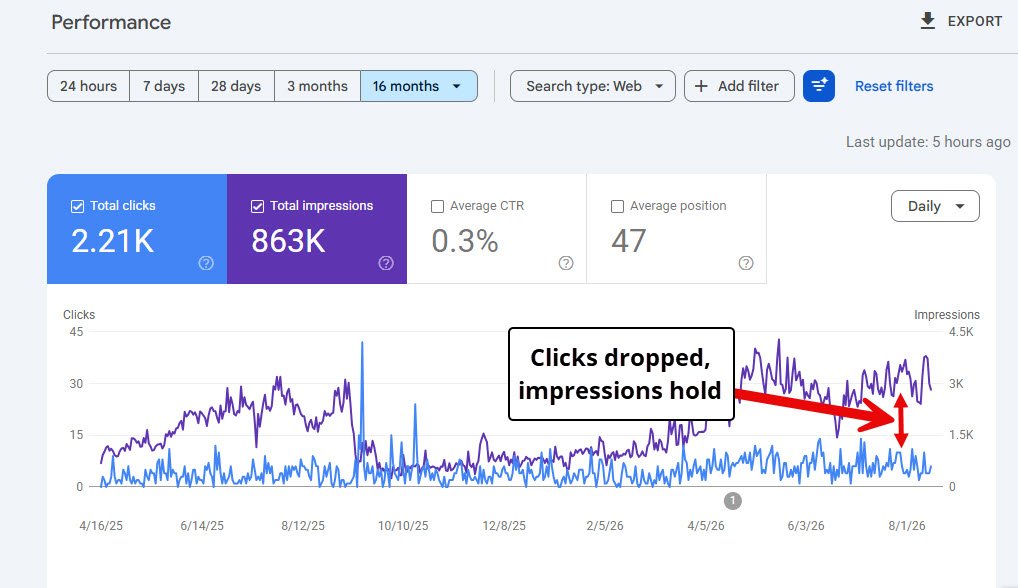
The gap is the story. The wider it gets, the more of your visibility is being converted into AI answers instead of sessions.
Note
A crocodile mouth is not automatically fine. It means your visibility is intact but your click capture is broken — which is a real problem worth solving, just not the one most people diagnose.
3. Separate Your AI Visibility From Your Organic Visibility
For two years, AI Overview impressions sat mixed into your normal Search Console totals with no way to isolate them.
That changed this summer.
Read Google’s Generative AI performance report
On June 3, 2026, Google launched dedicated Search Generative AI performance reports in Search Console, giving site owners a separate view of impressions within generative AI features on Search — including AI Overviews and AI Mode — as well as generative AI features in Discover.
The data starts on May 18, 2026, and there is no historical backfill before that date.
Here’s the important caveat: the reports show impressions only, broken down by page, country, device, and date. There’s no click, CTR, or query data yet — so you can see visibility, but not what it’s worth. Search Engine Journal’s walkthrough of the report covers how to read it without over-interpreting.
Google is also rolling the reports out to a subset of websites first while it gathers feedback, so an empty menu doesn’t mean you have zero AI visibility.
Here’s where to find it:
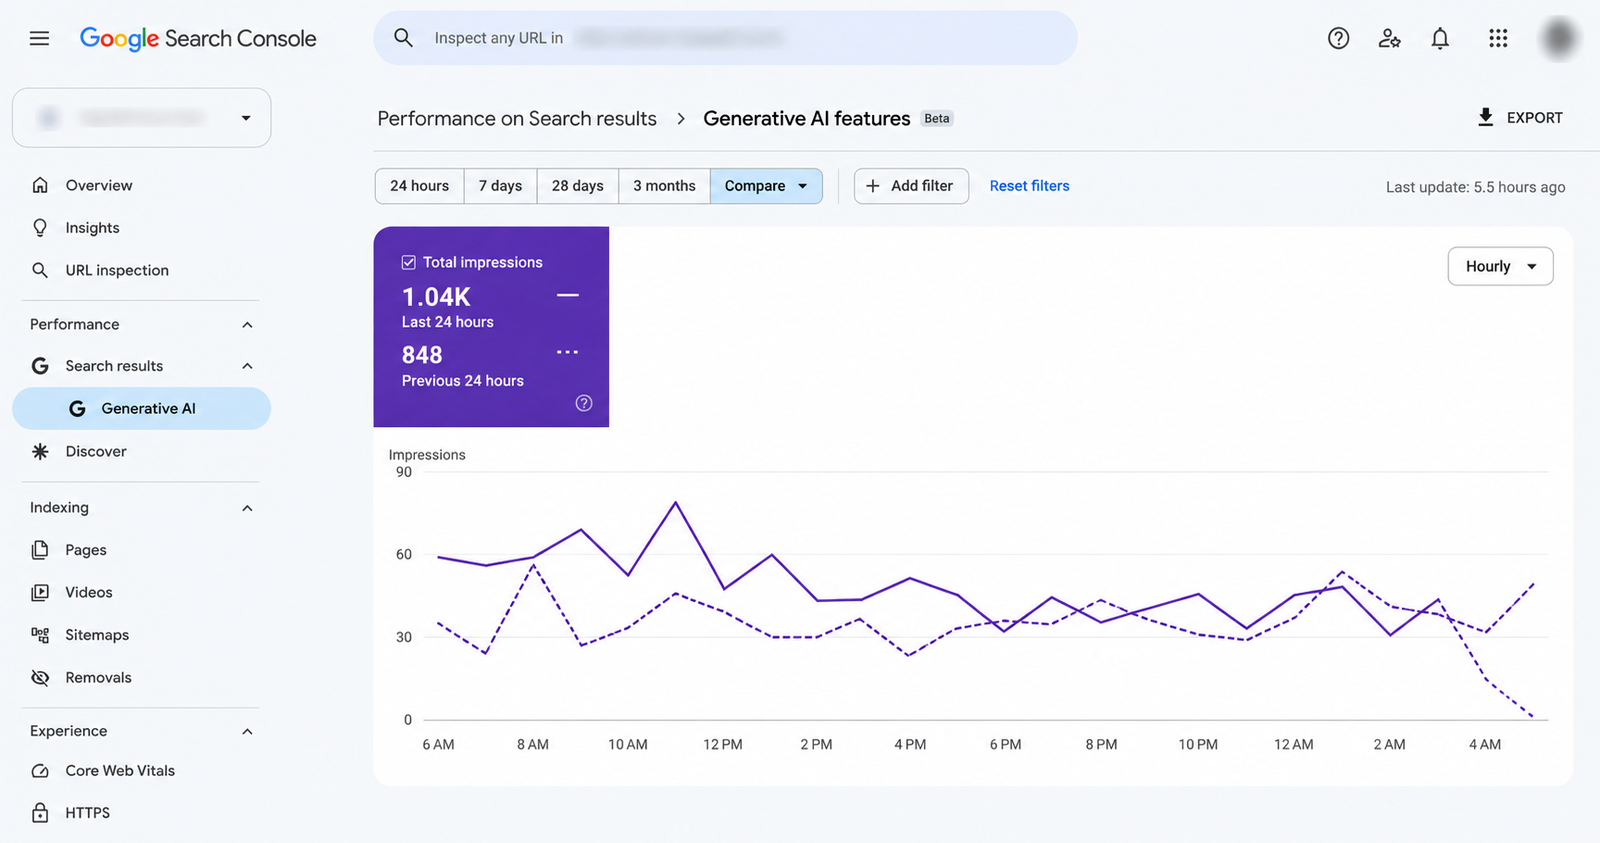
If you have access, this is the fastest way to answer the question everyone was guessing at last year: is my content inside AI answers at all?
Cross-reference it against your crocodile-mouth page list. Pages appearing in both are being cited and losing clicks — which is a very different situation from pages losing clicks with no AI presence.
Use Bing for the metric Google won’t give you
Microsoft got there first, and went further.
Bing’s AI Performance report launched in public preview in February 2026, and on June 16, 2026 Microsoft added four more capabilities — Intents, Topics, Citation Share, and Compare — all free and in preview globally.
Citation Share is the one that matters most.
It shows what portion of an answer’s citations your site earns versus other sources — a share-of-voice metric for AI citations that Google Search Console doesn’t yet offer.
A raw citation count tells you that you appeared. Citation Share tells you whether you dominated the answer or showed up as a footnote next to four competitors.
Here’s the report the metric lives in:
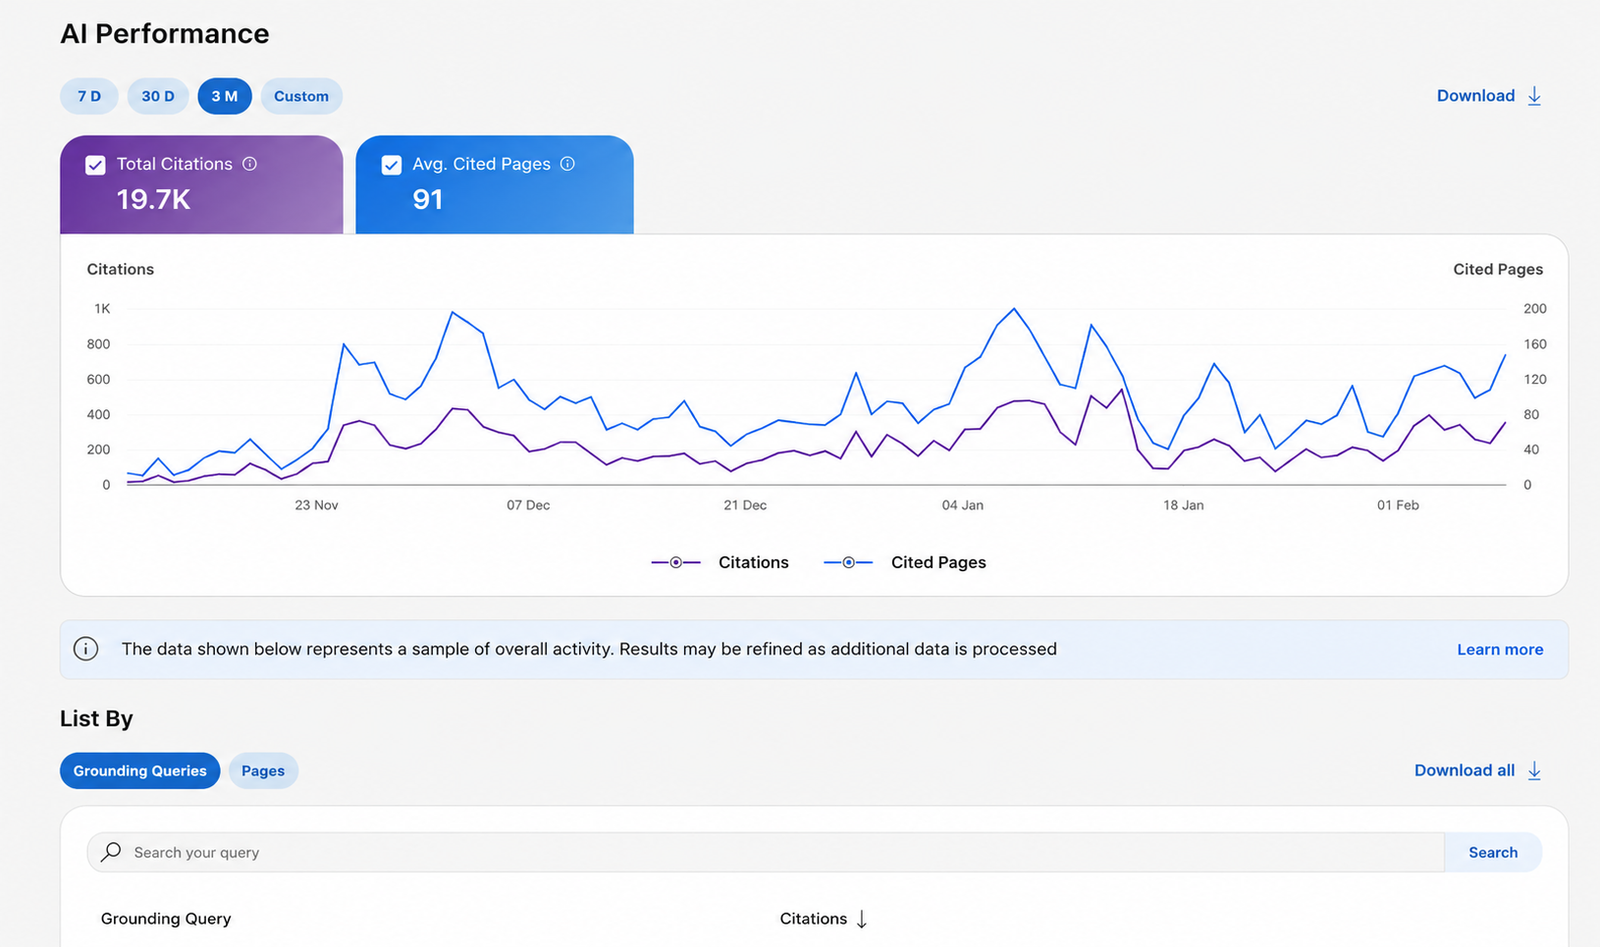
Track Citation Share month over month on your ten most commercially important topics. A rising share on a flat citation count still means your AI visibility is improving.
Note
Watch out for platform-side data corrections. Microsoft confirmed in early July 2026 that the sudden citation surges many site owners saw starting June 1 were routine data backfilling, not a visibility breakthrough.
That’s a general lesson, not a Bing-specific one. A dashboard spike that lines up suspiciously well with a platform announcement is a reporting artefact until proven otherwise.
4. Check Whether Rankings Are Moving in the Right Bands
Stop asking “are we number one?”
Ask “how many of our queries moved up a band this quarter?”
Position bands are ranges — 1–3, 4–10, 11–20, 21–50, 51–100 — and progress shows up as queries migrating between them long before anything hits page one.
A keyword going from position 34 to position 17 produces almost no traffic change.
It is still an unambiguous sign that your SEO is working.
Here’s the migration you want to see over 90 days:
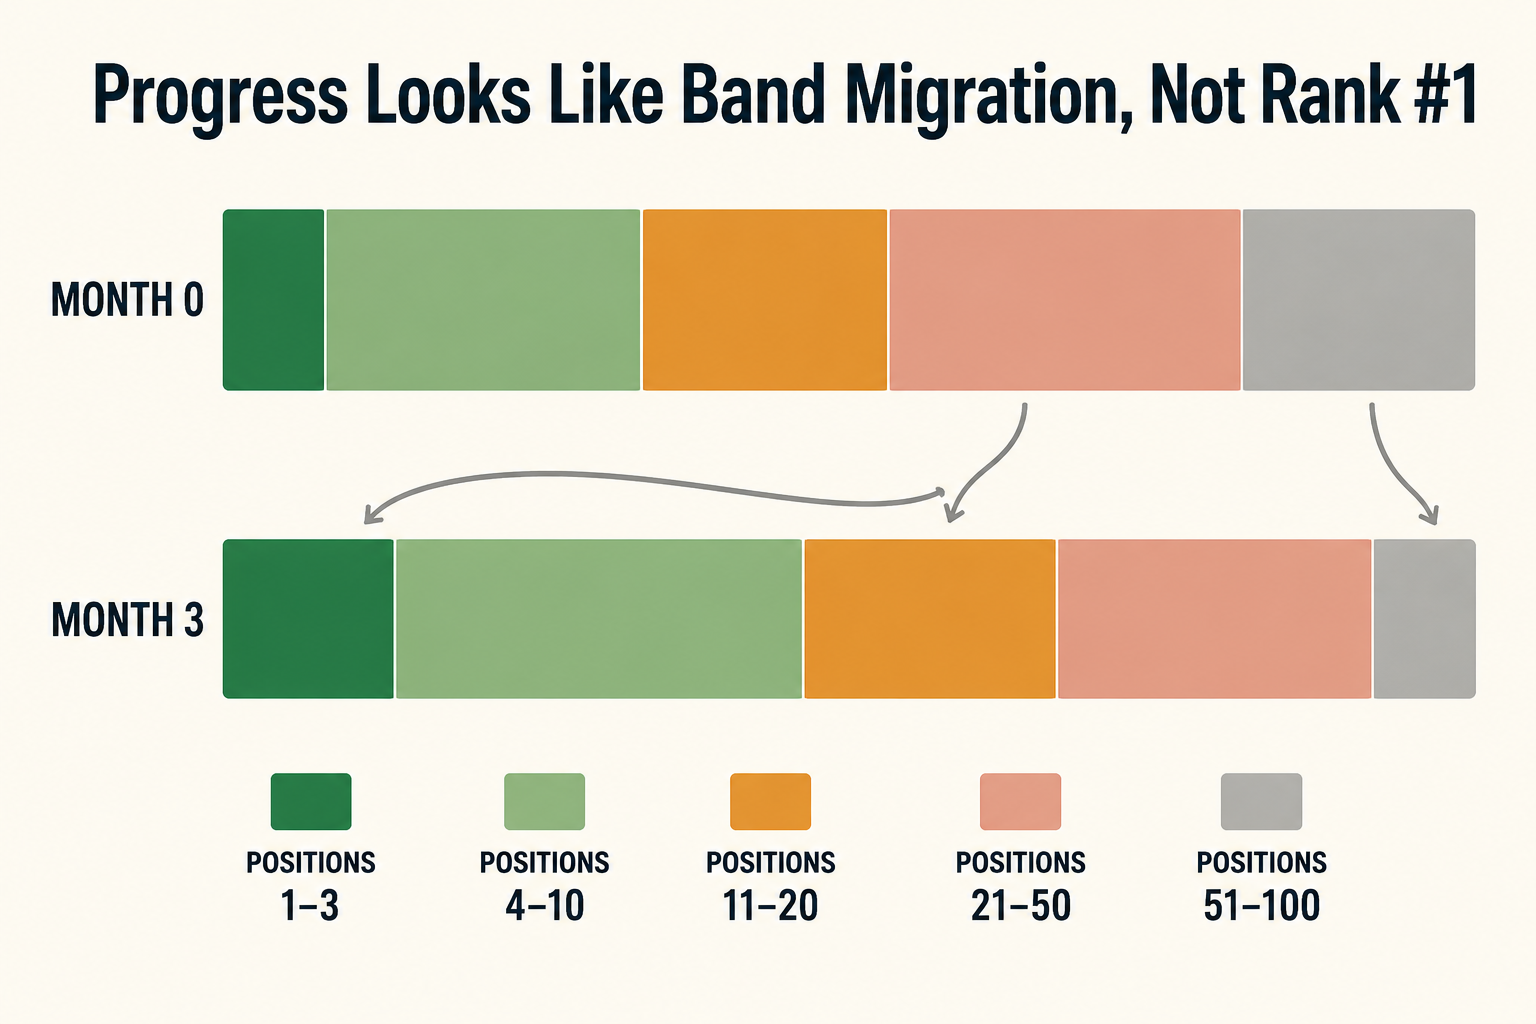
The grey shrinking is the leading indicator. The green widening is the lagging one.
Watch your striking-distance set
Striking-distance keywords are queries ranking in positions 4–20 — close enough that a modest improvement produces a real traffic change.
Fernwell had 62 of them at baseline.
Ninety days later it had 91, with eleven of the original 62 having crossed into the top three. Clicks were still down over the same window, because AI Overviews were eating the informational half of that set.
Both things were true at once. That’s normal now.
Filter Search Console for queries with average position between 4 and 20, sort by impressions descending, and count the rows. Do it every 28 days. The count is your progress metric.
5. Track Query Growth, Not Just Keyword Positions
Here’s a metric almost no reporting template includes: the number of unique queries your site appears for at all.
It’s the single best early signal that Google’s understanding of your site is expanding.
New topical territory shows up here first — weeks before it shows up in rankings, months before it shows up in traffic.
Pull it this way:
- Search Console → “Performance” → “Queries” tab
- Set a 28-day window and scroll to the bottom of the table
- Read the total row count shown above the table
That number is your query surface. Watch it monthly.
This matters more than it used to, and Google’s own retrieval mechanics explain why.
When an AI Overview or AI Mode answer is triggered, Google splits the original query into multiple related sub-queries — a process called query fan-out — and the pages appearing most often across those sub-queries get cited. Ahrefs points to fan-out as a growing factor in source selection.
Wider query coverage is how you get pulled into more of those retrievals.
Two more splits are worth pulling every month:
- Non-branded query count: strip out anything containing your brand name — this is your true discovery surface
- Question-format query count: filter for queries containing who, what, why, how, when, or “vs”
Pew Research’s browsing study found that longer searches trigger AI summaries far more often — just 8% of one- or two-word searches produced one, rising to 53% for searches of ten words or more.
So a growing question-query count means growing AI Overview exposure — for better and worse.
Tip
Export the query list monthly and diff it against last month’s export. The queries that appeared for the first time this month are your best clue to where Google thinks you’re getting more authoritative.
6. Follow the Clicks to Conversions — and Fix Your AI Attribution
Traffic that doesn’t convert isn’t proof of anything.
But before you can judge conversions, you have to fix a measurement gap that affects roughly every GA4 property on the internet.
Your AI traffic is hiding in “Direct”
Google shipped a native AI Assistant channel group in GA4 in late 2025, but it misses roughly 30% of active sources and it isn’t retroactive. Google’s confirmed list covers ChatGPT, Gemini, DeepSeek, Copilot, and Grok — Perplexity traffic still lands in generic “Referral.”
It gets worse. Google AI Mode explicitly uses a noreferrer attribute on its links, which makes AI Mode traffic untraceable in any client-side analytics tool.
Across platforms, somewhere between 35% and 70% of AI referral sessions arrive with no referrer header at all and get filed under “Direct.”
So if your dashboard says you get almost no AI traffic, the dashboard is probably wrong.
Here’s the fix, layer by layer:
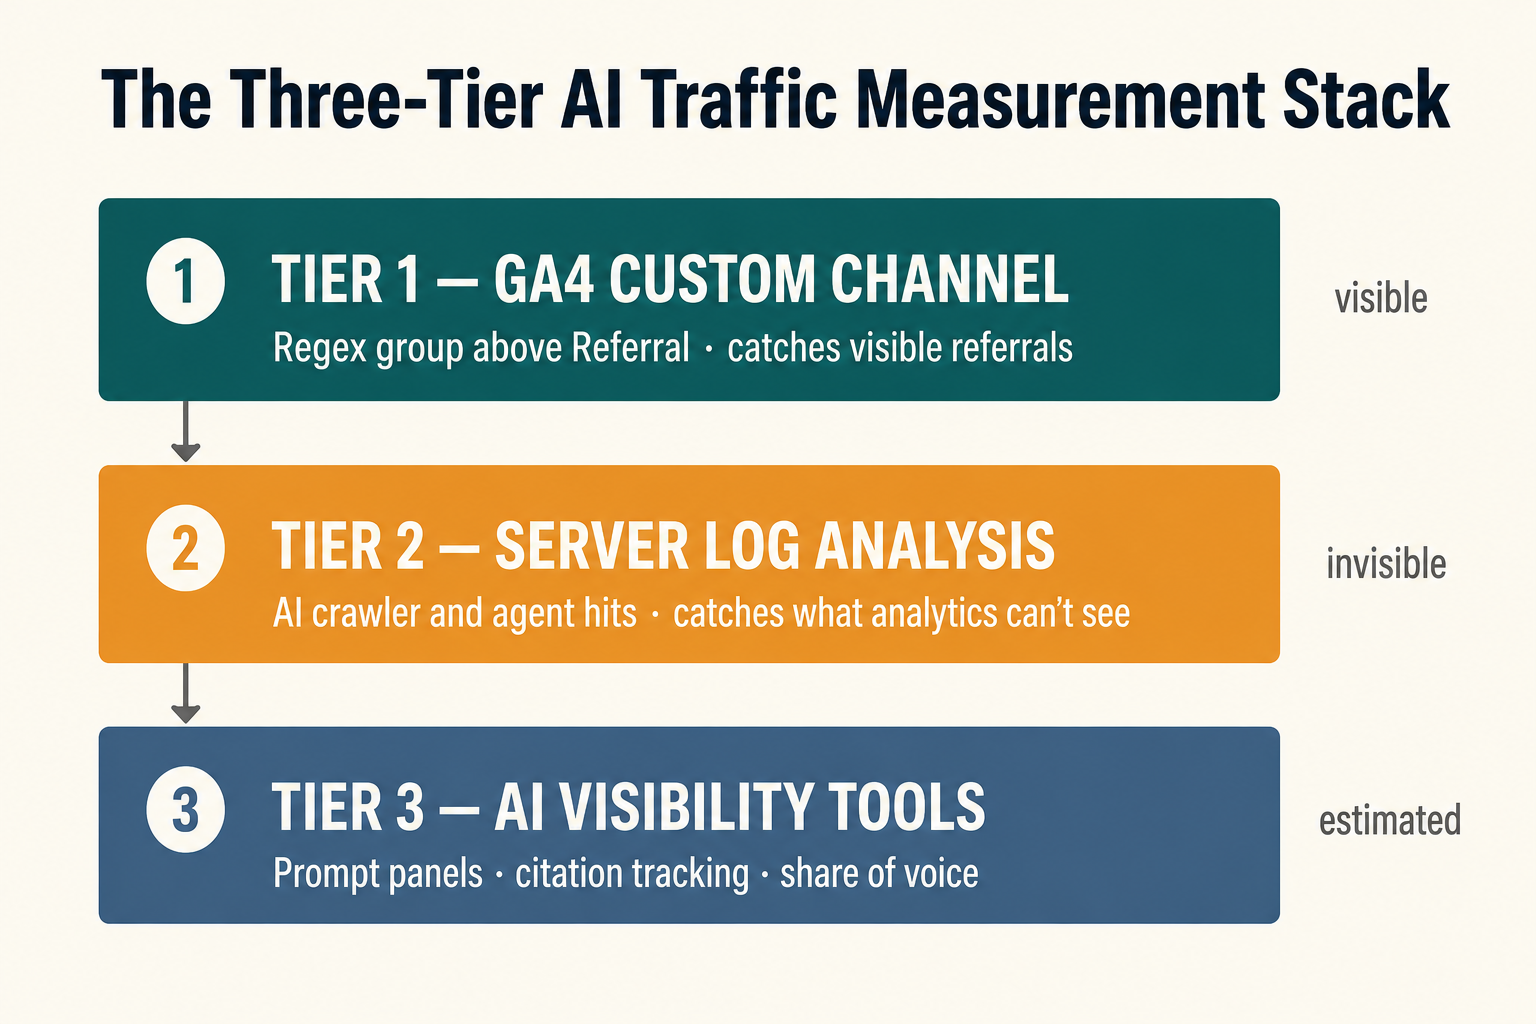
No single tier gives you the whole picture. Together they get you close enough to make decisions.
Set up tier one first. In GA4, create a custom channel group with a regex condition on session source matching your AI platforms, and order it above the default Referral channel so it captures traffic before Referral does.
ChatGPT now appends a utm_source parameter to its citation links, which improves attribution considerably — but only for sessions where the referrer survives the click.
Tier two matters more than most teams realise. Server logs show which AI crawlers and agents are actually hitting your pages — and in June 2026, Cloudflare CEO Matthew Prince reported that agentic traffic passed 50% of all internet traffic for the first time.
Then judge the conversion rate, not the volume
Once AI traffic is isolated, look at what it does.
Semrush found AI-referred visitors convert at 4.4x the rate of traditional organic visitors. Volume is small. Quality is not.
For Fernwell, AI referrals were 1.4% of sessions and 6% of subscriptions. Reported as a traffic number, it looked like noise. Reported as a revenue number, it was the fastest-growing channel in the business.
That distinction is the whole reason this step exists.
And here’s the check that keeps you honest:
Ahrefs documented a case where Wil Reynolds saw a 1,900% month-over-month jump in ChatGPT citations to a single page — then found it made little to no business impact.
A citation is not a conversion.
Track both, and report the one that pays.
Tip
Add “Landing page” as a secondary dimension on your AI traffic report. The pages AI platforms cite most are rarely the pages you’d have guessed — and they’re where your next optimisation effort should go.
7. Watch the Demand-Side Signals: Brand Search and Mentions
The slowest signals are the most honest ones.
Branded search volume is the number of people searching specifically for your name. It only goes up when more people know you exist and want to come back.
Nobody games their way to it.
Pull it in Search Console by filtering queries that contain your brand name, then chart the 28-day totals across six months. Rising branded search alongside rising non-branded impressions is about as clean a “this is working” signal as exists.
Brand mentions now predict AI citations
This is the finding that reordered a decade of SEO priorities.
Ahrefs analysed 75,000 brands and found that branded web mentions correlate with AI Overview visibility at 0.664 on the Spearman scale, while backlinks land at just 0.218 and content volume at 0.194. Branded search volume came in at 0.392 — closely matching Kevin Indig’s independent finding of 0.334 for ChatGPT mentions.
Ahrefs’ expanded follow-up, which added ChatGPT and Google AI Mode to the analysis, found an even stronger signal: YouTube mentions correlate at roughly 0.737 across all three surfaces — the highest of any factor tested.
Read that ordering again.
The strongest predictors of whether AI engines cite you are all off-site brand signals. Not domain rating. Not link count.
Here’s the correlation ranking:
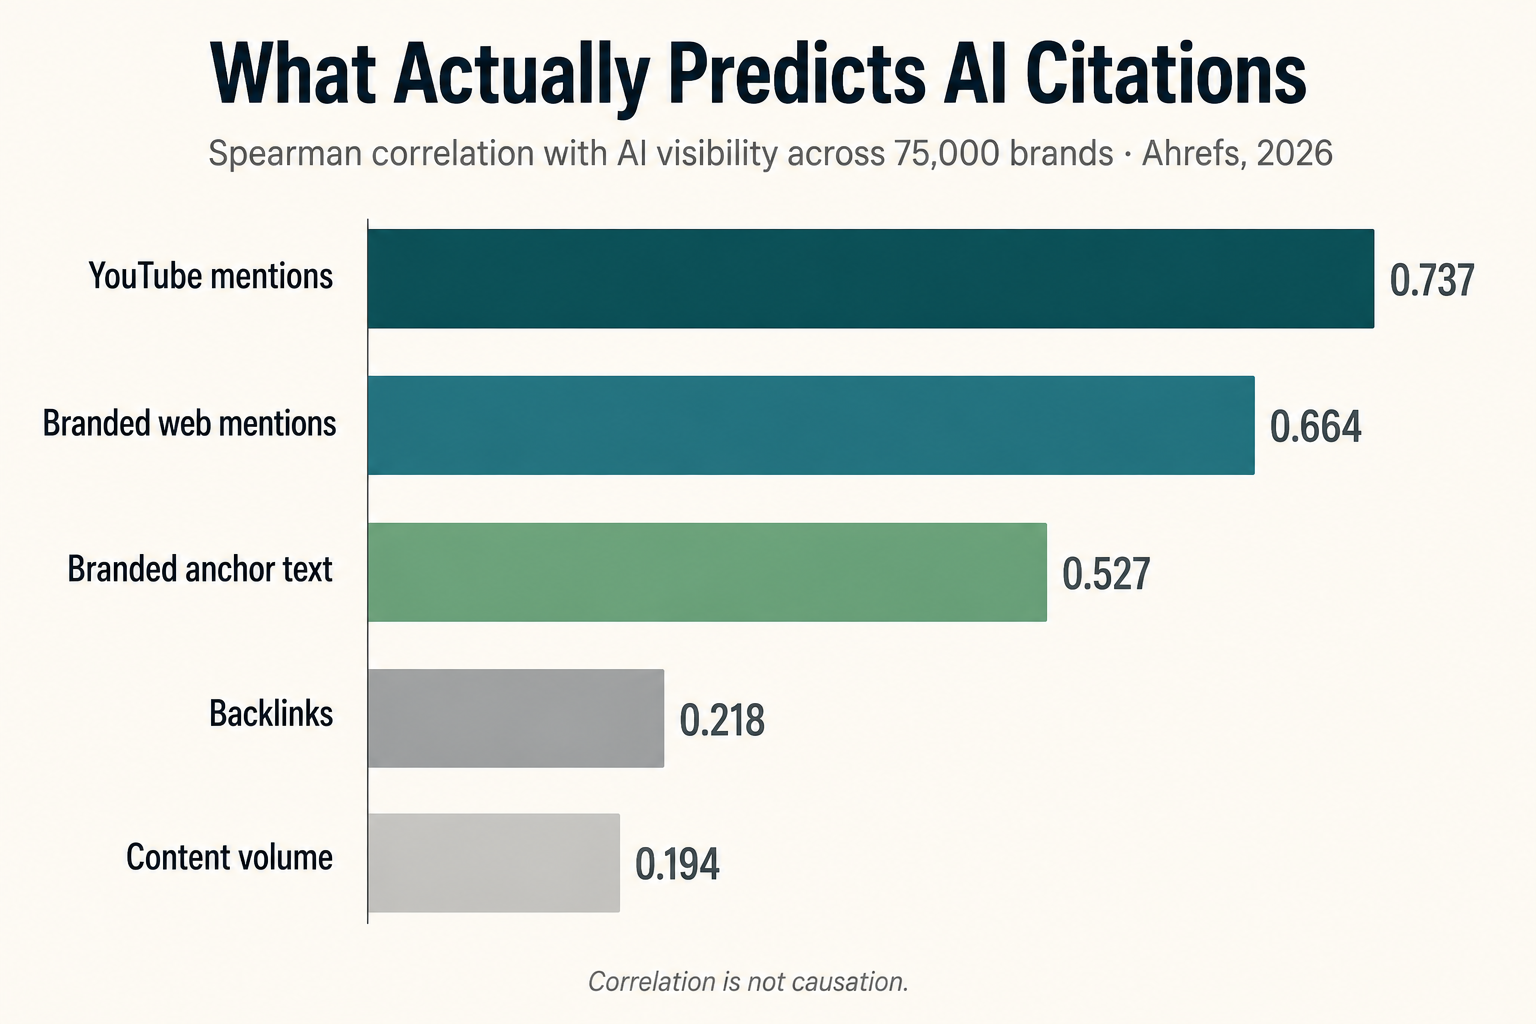
The researchers were explicit that correlation isn’t causation, and that caveat is load-bearing. Brands with high AI visibility tend to be well-known brands, and well-known brands get mentioned everywhere.
But directionally, it changes what you put on a report.
Track unlinked brand mentions monthly. Track YouTube coverage. Both belong on the same dashboard as your rankings now.
8. Score It: The 90-Day SEO Health Check
Individual metrics argue with each other. A score settles it.
Run this every quarter. Award one point per row where the answer is yes.
Leading signals — should move within 30 to 60 days:
- Unique query count is up vs the previous 28-day window
- Non-branded impressions are up
- Striking-distance keyword count (positions 4–20) has grown
- Crawl and indexing errors are flat or falling
Mid signals — should move within 60 to 120 days:
- Queries have migrated upward between position bands
- Pages appear in the Search Console generative AI report
- Bing Citation Share is stable or rising on priority topics
- Non-branded clicks are up, or flat with rising impressions
Lagging signals — 120 days and beyond:
- Organic conversions or revenue are up
- Branded search volume is up
- Unlinked brand mentions are up
- AI referral sessions convert above your organic baseline
Score it like this:
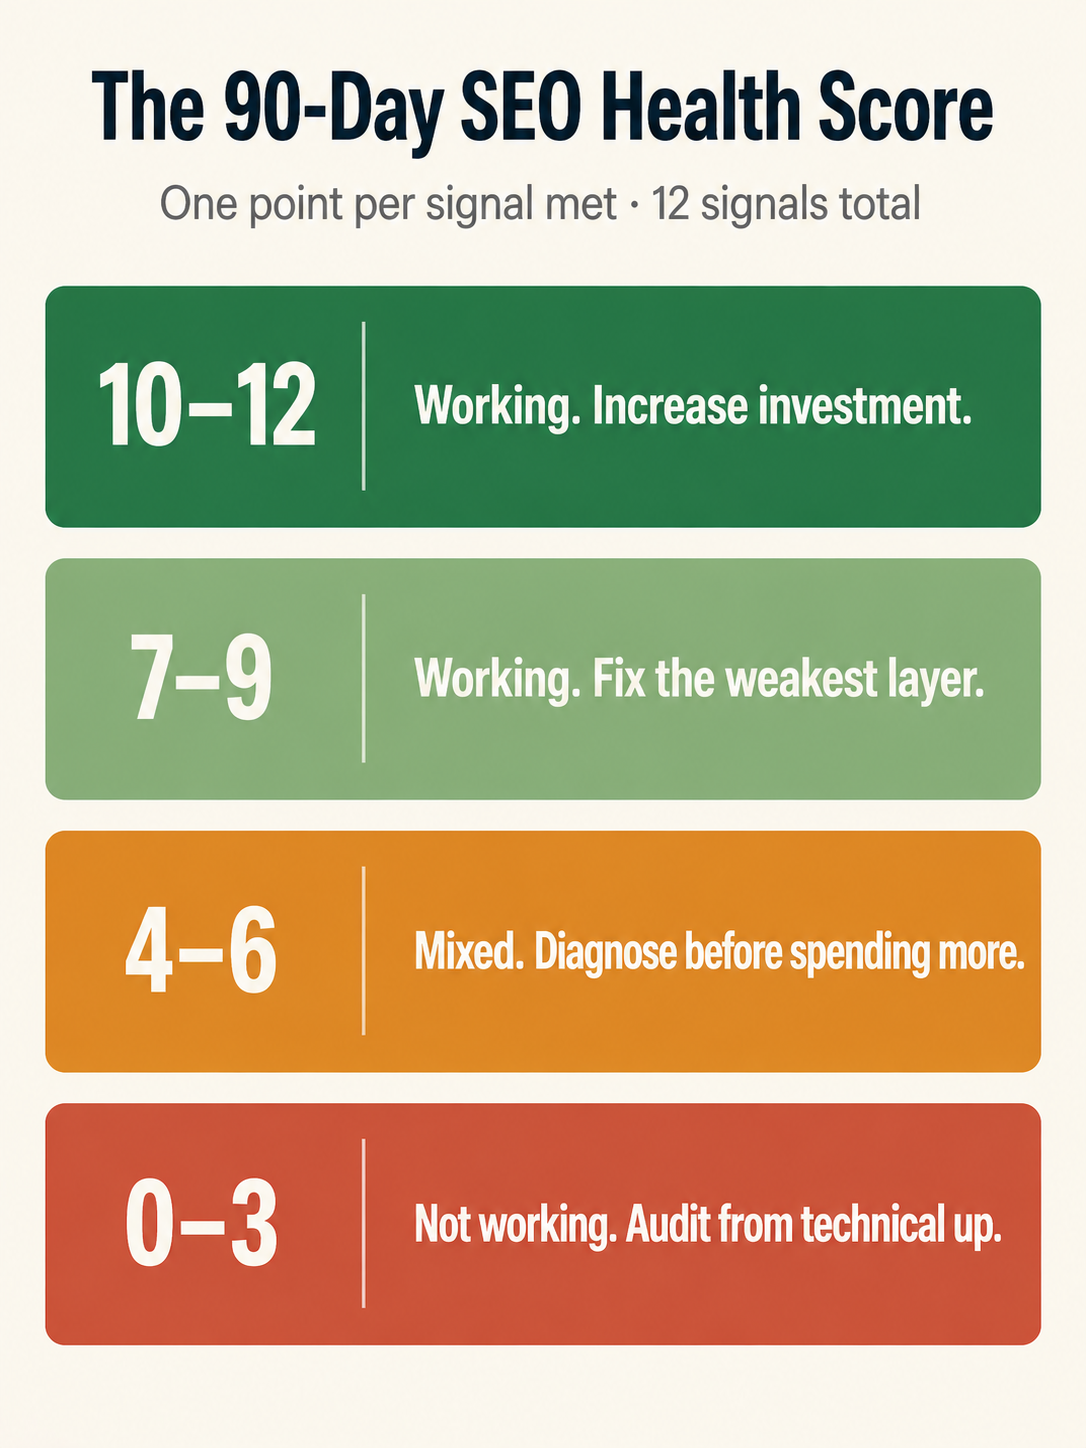
The thing to watch isn’t your score. It’s whether your score is climbing.
A site scoring 5 that scored 2 last quarter is in far better shape than a site scoring 8 that scored 11.
Signs Your SEO Is Genuinely Not Working
Everything above tells you what success looks like. This section covers the four failure patterns and what each one actually means.
Impressions falling while your published page count rises. You’re adding content that Google doesn’t want to show. Check for thin pages, duplicate intent between posts, and whether your new pages are even indexed.
Rankings holding but conversions falling. This is a page-experience or intent problem, not a search problem. You’re attracting the wrong searchers, or the right ones are bouncing off the page.
Clicks and impressions both falling on the same pages, with no algorithm update nearby. This is the real decline quadrant. Start with a technical audit — indexation, canonicals, internal crawl paths, server response codes.
Everything flat for six-plus months across every signal. Flat is a result. It means your effort level isn’t clearing the competitive bar in your niche, and doing more of the same won’t change it.
Note
Six months of flat is a strategy problem, not an execution problem. More posts at the same quality will produce more flat.
The Data Everyone Cites Contradicts Itself. Here’s How to Handle That.
If you’ve read three articles on AI visibility, you’ve probably absorbed three incompatible statistics.
Some of that is sloppiness. A lot of it isn’t.
Take the most-quoted question in the field: how much do AI citations overlap with the organic top 10?
Here’s what the major studies found:
| Study | Surface | Finding | Sample |
|---|---|---|---|
| Ahrefs, July 2025 | AI Overviews | 76.1% of cited pages rank in the top 10 | 1.9M citations |
| Ahrefs, Feb 2026 | AI Overviews | 38% of cited pages rank in the top 10 | 863K keywords, 4M URLs |
| BrightEdge, Feb 2026 | AI Overviews | ~17% top-10 overlap | Separate methodology |
| Moz, Feb 2026 | AI Mode | 88% of citations are not in the organic SERP | ~40,000 queries |
Two of those gaps have clean explanations.
The Ahrefs 76% → 38% drop isn’t a contradiction — it’s a real change over seven months, with the remaining citations split almost evenly between positions 11–100 (31.2%) and pages outside the top 100 (31%). Anyone still quoting the original 76% figure is quoting a superseded number.
And Moz’s 88% measures a different surface entirely. AI Mode uses query fan-out aggressively, so its citations pull from a far wider net — YouTube, Reddit, LinkedIn, niche authority sites — than AI Overviews do.
The Ahrefs-vs-BrightEdge gap, though, is genuinely unresolved. Same surface, same period, 38% versus 17%. Different datasets and methodologies, and no way to reconcile them from the outside.
So what do you do with that?
Use it to set direction, not targets.
The direction every study agrees on: ranking well still helps, and it is no longer sufficient on its own. That’s actionable. “Get to 38% overlap” is not.
Here’s a second example worth holding onto. Ahrefs surfaced a study in which a page was run through a standard generative-engine-optimisation checklist — statistics added, quotations added, source citations added, authoritative tone applied — across three AI engines. On GPT-4o-mini, the untouched page was cited 13.3% of the time. The optimised version landed lower, between 10.9% and 12.2%.
The tactics being sold as best practice lost to doing nothing at all.
One study isn’t proof. But it’s a good reason to run your own tests before you rebuild your content process around a checklist someone published in a newsletter.
Test your own site instead:
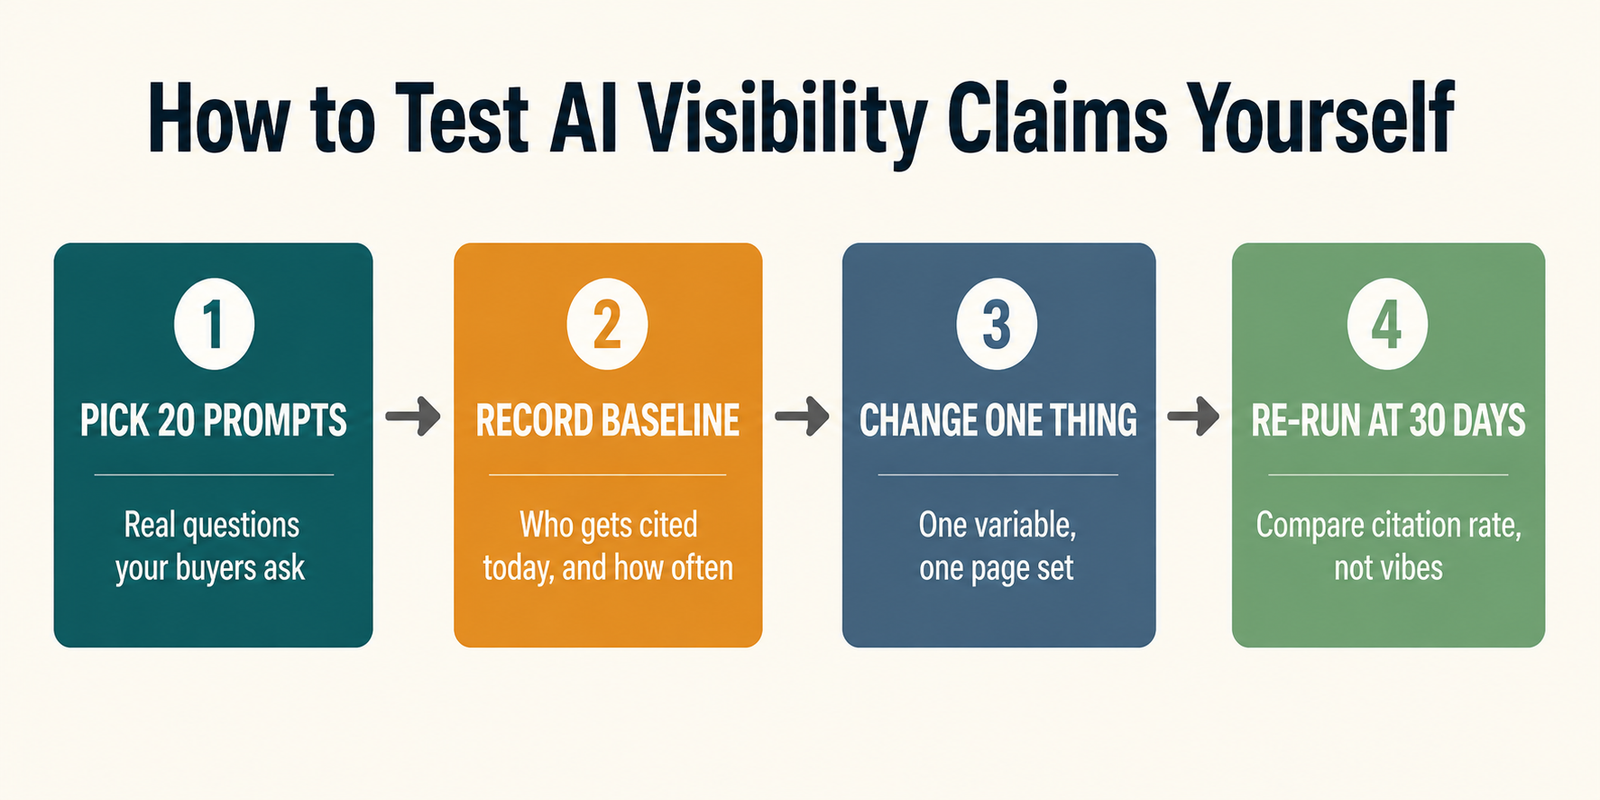
Twenty prompts is enough to spot a real effect. It’s also small enough that you’ll actually do it.
How Long Before You Can Tell?
Short answer: 30 days for the first honest signal, 90 for a verdict, 180 for proof.
Here’s the realistic timeline.
Weeks 1–4. Indexation and crawl changes land. Unique query count starts moving. Nothing about traffic is readable yet.
Weeks 5–12. Position bands shift. Striking-distance sets grow. Impressions respond. Clicks may still be flat, and that’s expected.
Weeks 13–24. Non-branded clicks respond. Conversions become readable. Your first defensible answer to “is this working” arrives here.
Weeks 25–52. Branded search and brand mentions move. Compounding starts. This is where good SEO stops looking linear.
Fernwell hit month four with clicks still down 31% and every leading indicator up. Month seven, non-branded clicks crossed the old baseline. Month nine, subscriptions from organic were up 22% on a session count that never fully recovered.
Fewer visitors. More customers.
That’s what working looks like now.
A timeline helps here:
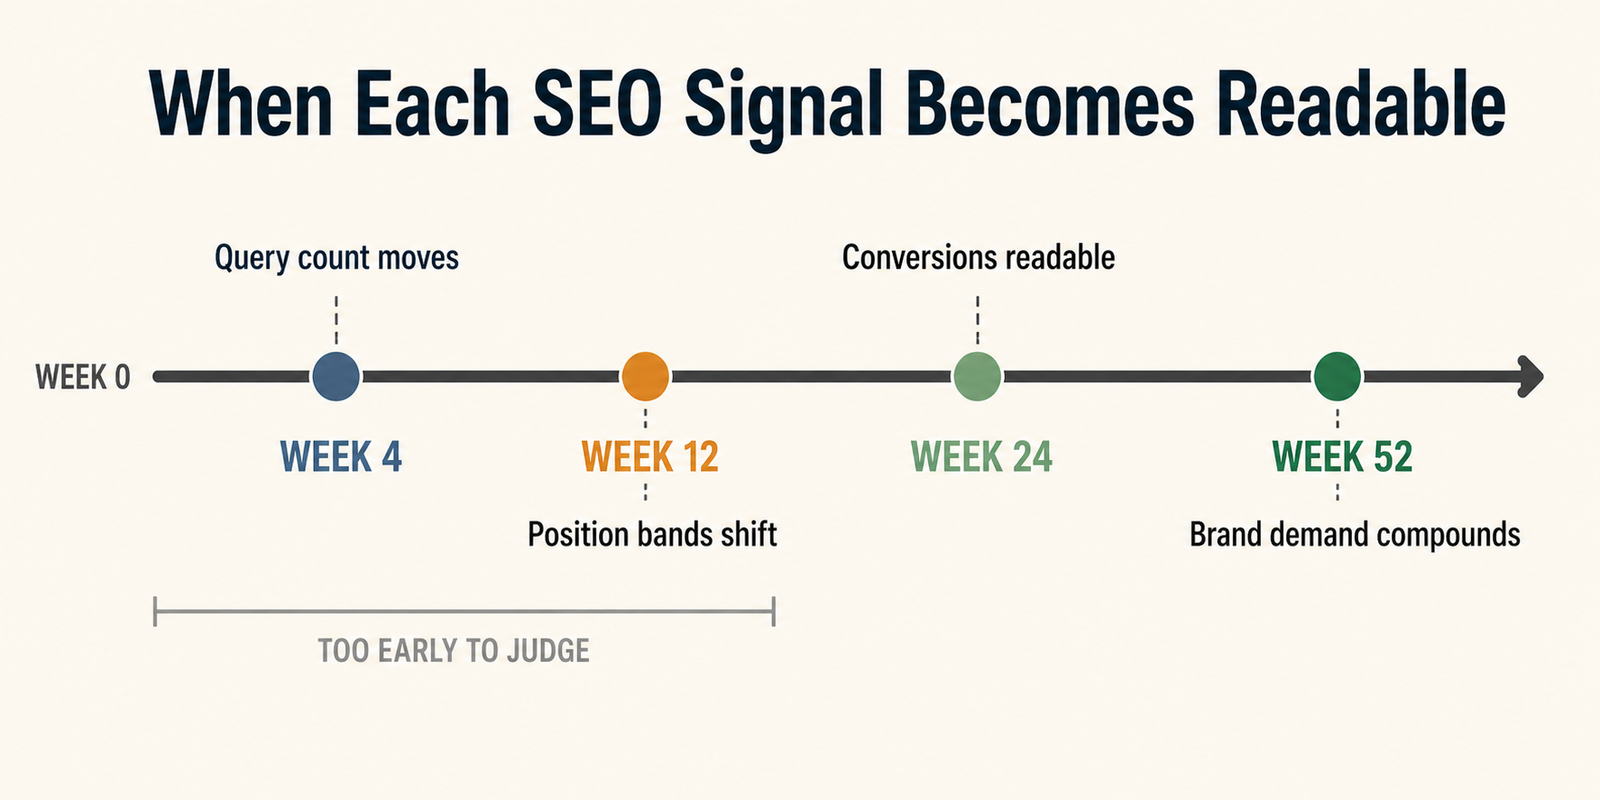
The grey band is the part clients and executives find hardest. Name it up front and you’ll spend less time defending it later.
FAQs
How do I know if my SEO is working if my traffic is down?
Check impressions before you check anything else.
If impressions held steady or rose while clicks fell, your visibility is intact and something on the results page is intercepting the click — usually an AI Overview. That’s a capture problem, not a ranking problem.
If impressions fell alongside clicks, you have a genuine visibility decline. Start with indexation and technical health.
The two situations need completely different fixes, and the traffic number alone can’t tell them apart.
Does appearing in AI Overviews help or hurt my SEO?
Both, depending on the query.
Seer Interactive’s analysis of 3,119 informational queries across 42 organisations found that brands cited in AI Overviews earn 35% more organic clicks and 91% more paid clicks than uncited brands on the same queries. Being cited is better than not being cited.
But the overall click pool shrinks when an AI Overview appears. Pew Research’s behavioural study of 68,879 real Google searches found users clicked a traditional result only 8% of the time when an AI summary was present, versus 15% without one — and clicked a source inside the summary just 1% of the time.
So citation improves your slice while the pie gets smaller.
One update worth knowing: Seer’s 2026 refresh found CTRs stabilised and partially rebounded in early 2026. The floor is lower than 2024, but it stopped falling.
Should I block my content from AI Overviews?
Almost certainly not.
Google shipped a control that lets site owners block content from AI Overviews, AI Mode, and Discover AI features, and began honouring it on June 17, 2026. It’s separate from Google-Extended, which governs model training rather than live answers.
The arithmetic argues against using it. Opting out forfeits both your AI impressions and whatever traffic those features do send — and Google still doesn’t publish click data for AI features, so you’d be trading away an unknown quantity.
Establish a baseline in the generative AI report first. Then decide.
What’s the single most reliable sign that SEO is working?
Growth in non-branded impressions and unique query count, sustained over three consecutive 28-day windows.
It’s early, it’s hard to fake, and it moves before anything else does.
Clicks are downstream of a SERP layout you don’t control. Conversions are downstream of your product and your pages. Query surface is the cleanest read on whether Google’s understanding of your site is expanding.
How often should I check these metrics?
Weekly for anomalies. Monthly for direction. Quarterly for decisions.
Checking rankings daily produces anxiety, not insight — normal fluctuation is large enough to look like a trend over any window shorter than a couple of weeks.
Set a 28-day reporting cadence and hold to it.
There’s a lot to balance here, and no single number settles the question anymore.
Start narrow. Pull one 28-day Search Console export today, plot impressions against clicks, and sort your pages by which quadrant they land in.
You’ll know within twenty minutes whether you’re looking at a ranking problem or a click-capture problem — and those two answers send you down completely different roads.
Sources
Every statistic in this guide traces back to a named primary study. Where figures conflict, both are shown above rather than the more convenient one.
- Google Search Central — Introducing Search Generative AI performance reports in Search Console (June 3, 2026)
- Google — New controls for website owners (AI feature opt-out, effective June 17, 2026)
- Microsoft Bing — New AI Visibility Insights in Bing Webmaster Tools: Intents, Topics, Citation Share, Compare (June 16, 2026)
- Pew Research Center — Do people click on links in Google AI summaries? (68,879 searches, 900 US adults, July 22, 2025)
- SparkToro — In 2026, Less than One Third of Google Searches Still Send a Click (Similarweb panel, Jan–Apr 2026)
- Seer Interactive — AIO Impact on Google CTR: September 2025 Update and the 2026 Update (3,119 queries, 42 organisations, 25.1M impressions)
- Ahrefs — Update: AI Overviews Reduce Clicks by 58% (300,000 keywords, GSC data)
- Ahrefs — An Analysis of AI Overview Brand Visibility Factors (75,000 brands)
- Ahrefs — 76% of AI Overview Citations Pull From Top 10 Pages (July 2025 — superseded, see next)
- Search Engine Journal — Google AI Overview Citations From Top-Ranking Pages Drop Sharply (Ahrefs update: 863K keywords, 4M URLs)
- Search Engine Journal — Google Now Reports AI Search Impressions. Here’s How To Read Them
- TNW — YouTube mentions are the top signal for AI brand visibility (Ahrefs 75,000-brand follow-up)
- Ahrefs — 5 AI Search Trends I’m Seeing in 2026 (crocodile-mouth pattern, agentic traffic, GEO checklist test)

