


An SEO report is a monthly document that translates search performance into decisions a client can act on — what changed, why it changed, and what happens next.
It is not a dashboard. A dashboard answers “what are the numbers.” A report answers “what should we do about them.”
That distinction is where most reports fail.
Clients rarely leave because rankings dipped. They leave because eleven months of PDFs never explained what they were paying for.
So the report is a retention artifact before it’s an analytics artifact. Build it accordingly.
Here’s what this guide covers:
- Purpose: deciding what the report is for before you open a single tool
- Data: the four sources every report pulls from
- Selection: why nine metrics is the ceiling, not the target
- Honesty: splitting branded from non-branded so the numbers mean something
- Narrative: executive summaries, recommendations, and the bad-month protocol
Our running example is Verdant Supply, a B2B ecommerce company selling commercial landscaping equipment. Small agency, monthly retainer, one stakeholder — a marketing manager named Dana who reports to a CFO who has never opened Search Console.
That last detail shapes everything below.
1. Decide What the Report Is For
Before you pull data, answer one question: who reads this, and what decision do they make with it?
Dana reads it. The CFO skims page one. Those are two different documents sharing one file.
Separate the Dashboard From the Report
Give the client a live dashboard if they want one. Looker Studio, Semrush, whatever — it costs you nothing after setup and it satisfies the client who likes to poke at numbers on a Tuesday.
But the dashboard is not the deliverable.
The report is a written document you produce monthly, in which a human being interprets what the dashboard shows. If your “report” is a link to a dashboard, you have outsourced the hardest and most valuable part of your job to the client.
That’s the part they’re paying for.
Agree the Success Metric at Kickoff
Here’s the mistake that breaks reporting relationships: reporting against last month.
Month-over-month movement is mostly noise. Seasonality, algorithm updates, a competitor’s campaign, one big page getting indexed. None of it says whether the engagement is working.
Report against the commitment instead.
At kickoff with Verdant, the agency committed to a specific outcome: grow non-branded organic sessions 40% within twelve months. Every monthly report opens against that line, not against April.
That single framing does three things. It makes a bad month survivable, because one month is not the goal. It makes a good month meaningful. And it stops the client inventing their own success criteria between reports.
Note
If you never set a numeric commitment at kickoff, set one now, with the client, before the next report goes out. Reporting without an agreed target means every month gets judged on vibes.
2. Pull Data From Four Sources
Every credible SEO report draws on four buckets. More sources than that and you’re padding.
Here’s what each one is for:
- Google Search Console: impressions, clicks, CTR, average position, and query-level data — the only first-party record of how Google actually treats the site
- Google Analytics 4: what happened after the click — sessions, engagement, conversions, revenue
- A rank tracker: position movement on the specific keyword set you agreed to target
- An AI visibility tool: how often the brand appears in AI-generated answers
The fourth one is new, and it’s no longer optional. More on it in Step 3.
You may also pull backlink data from Ahrefs or Semrush, and Core Web Vitals from Search Console. Treat those as appendix material rather than headline sections.
Fix Your Date Ranges Before You Export
Two ranges, applied consistently every month:
- This month vs. the same month last year, which controls for seasonality
- Rolling 12 months, which shows the trend the commitment is measured against
Verdant sells commercial mowers. Their March is always triple their November. A month-over-month chart makes the agency look like geniuses every spring and idiots every autumn.
Set it once in Search Console and it sticks:
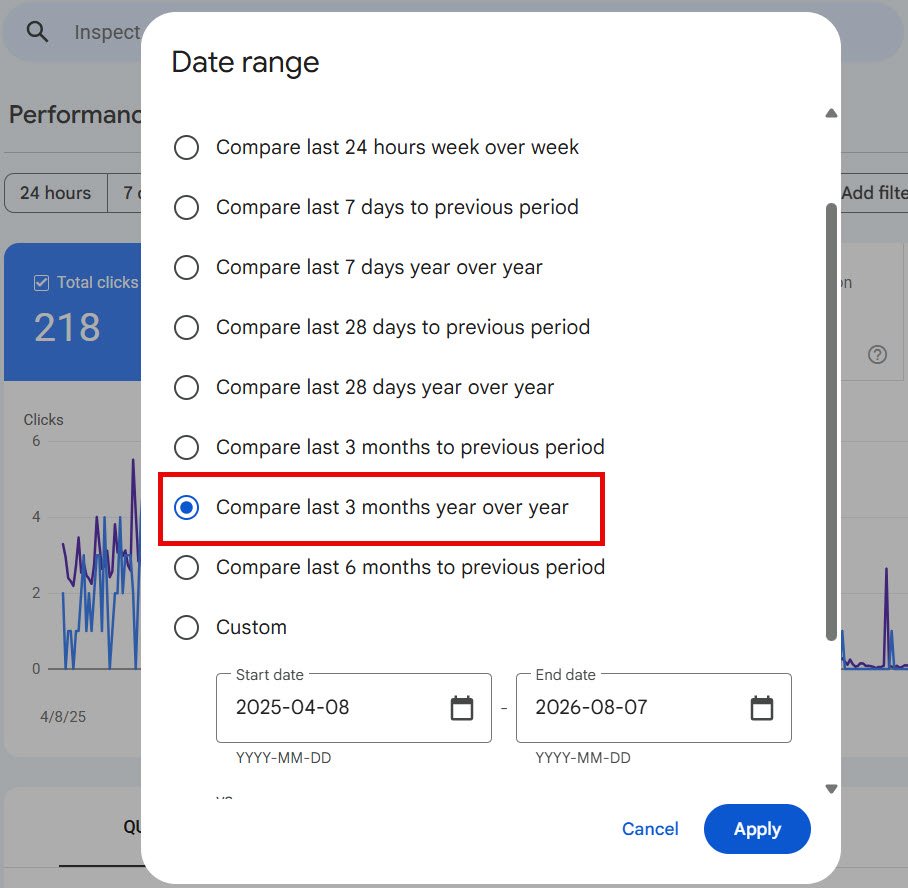
Year-over-year removes that noise entirely.
Tip
Search Console holds only 16 months of data. Export monthly to a sheet from day one of the engagement, or you’ll lose the baseline you need to prove year-two progress.
3. Cut to Nine Metrics
Nine is the ceiling. Not the target.
Every metric you add past the point of usefulness costs attention, and attention is the scarce resource in a client relationship. A report with 24 charts doesn’t look thorough. It looks like you couldn’t decide what mattered.
Start With the Core Four
These four earn their place in every report, in every vertical:
- Non-branded organic clicks: the honest measure of whether SEO is working
- Organic conversions or revenue: the number the CFO cares about
- Keyword position movement on the agreed target set, not on everything
- Organic CTR by page: where impressions exist but clicks don’t
If you reported only these four, you’d have a better report than most agencies produce.
Add the AI Visibility Layer
Search stopped being only blue links, and reports that ignore that look dated.
A brand can hold position one and receive no clicks because an AI Overview answered the query above it. A brand can have no ranking at all and receive traffic because an assistant cited it. Neither shows up in a traditional report.
Add two metrics:
- AI presence rate: the share of your tracked queries where the brand appears in an AI answer
- Cited pages: which specific URLs are getting pulled into those answers
Tools like Semrush, Otterly, Peec, and Nightwatch all track some version of this. Pick one and stay with it — switching tools resets your trend line.
One caveat worth telling the client plainly. When someone reads an AI answer citing the brand and then types the URL directly, GA4 files that session as direct traffic. You cannot fully attribute it. Report AI visibility as a directional signal, not a precise one.
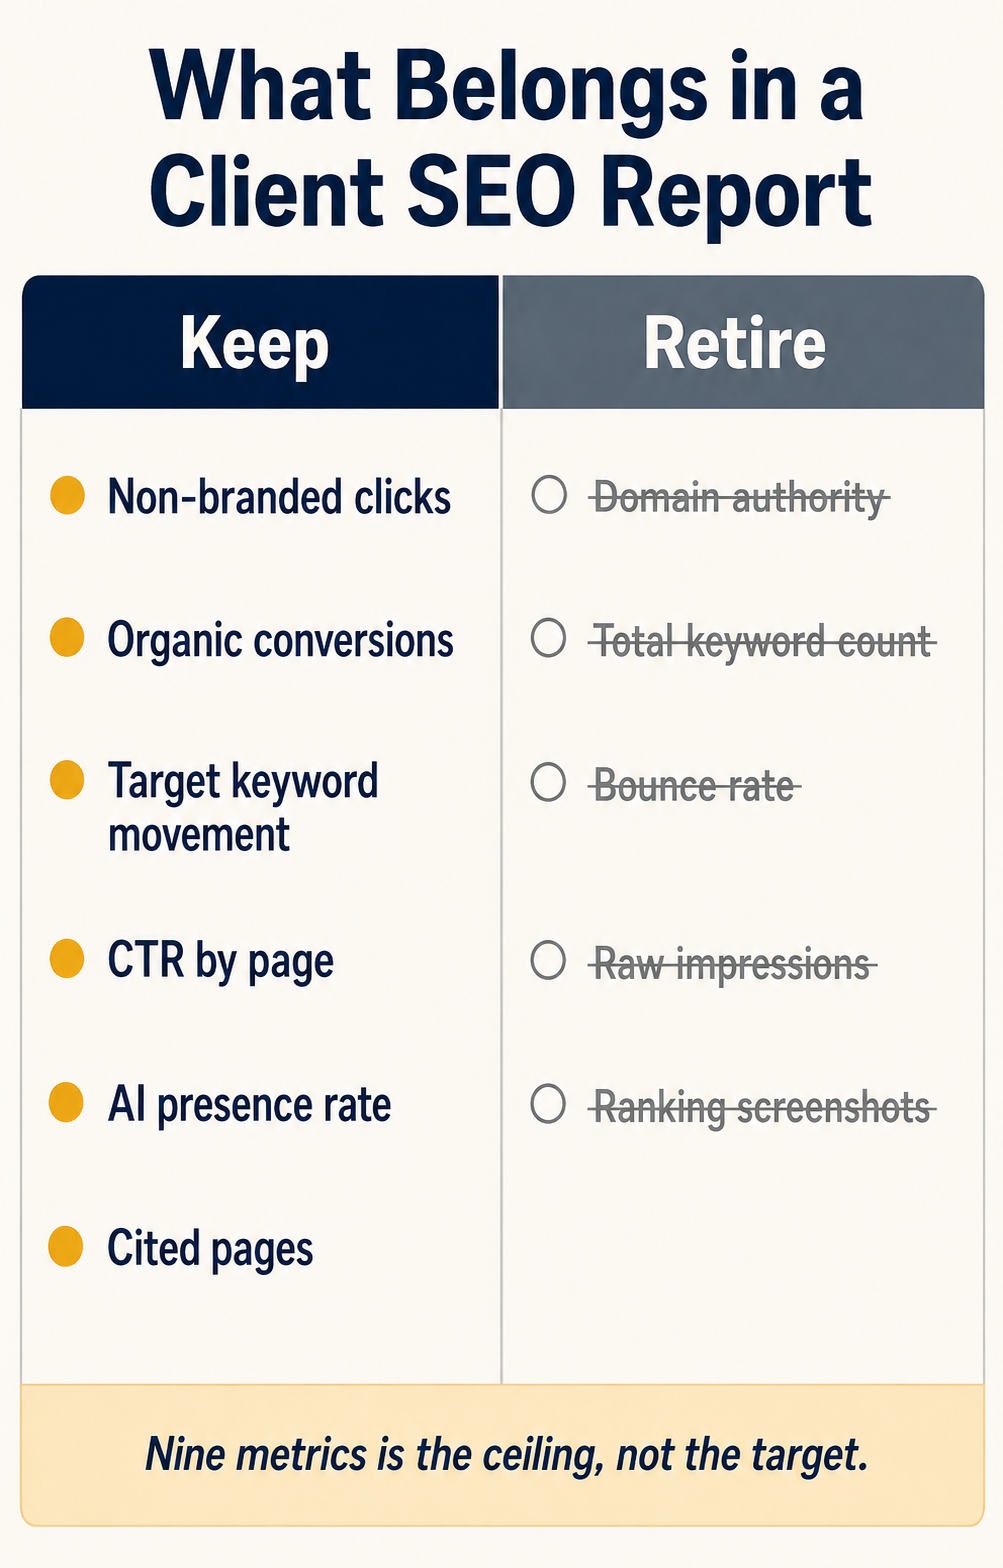
The right column is the interesting one. Take it seriously.
Retire the Metrics That Signal Old Thinking
Domain authority is a third-party estimate invented by Moz. Google does not use it. Putting it on page one of a client report tells an informed reader you’re measuring a proxy instead of an outcome.
Same for total keyword count. Ranking for 4,000 keywords means nothing if 3,900 are irrelevant long-tail variants nobody searches.
Same for raw impressions without CTR beside them. Impressions can rise while clicks fall — that’s usually a sign your titles are being rewritten, not a win.
4. Split Branded From Non-Branded
This is the single most honest thing you can do in an SEO report.
Branded traffic — people searching “Verdant Supply” by name — arrives largely because of brand awareness, PR, and existing customers. It’s real traffic. It is mostly not the result of your SEO work.
Non-branded traffic is.
When you report a blended organic number, you take credit for the client’s own brand equity. It inflates your results, and any client who eventually notices will wonder what else was inflated.
Search Console added a built-in branded/non-branded filter to the Performance report in late 2025, so this no longer requires regex gymnastics. Apply the filter, report the split, and make non-branded the headline figure.
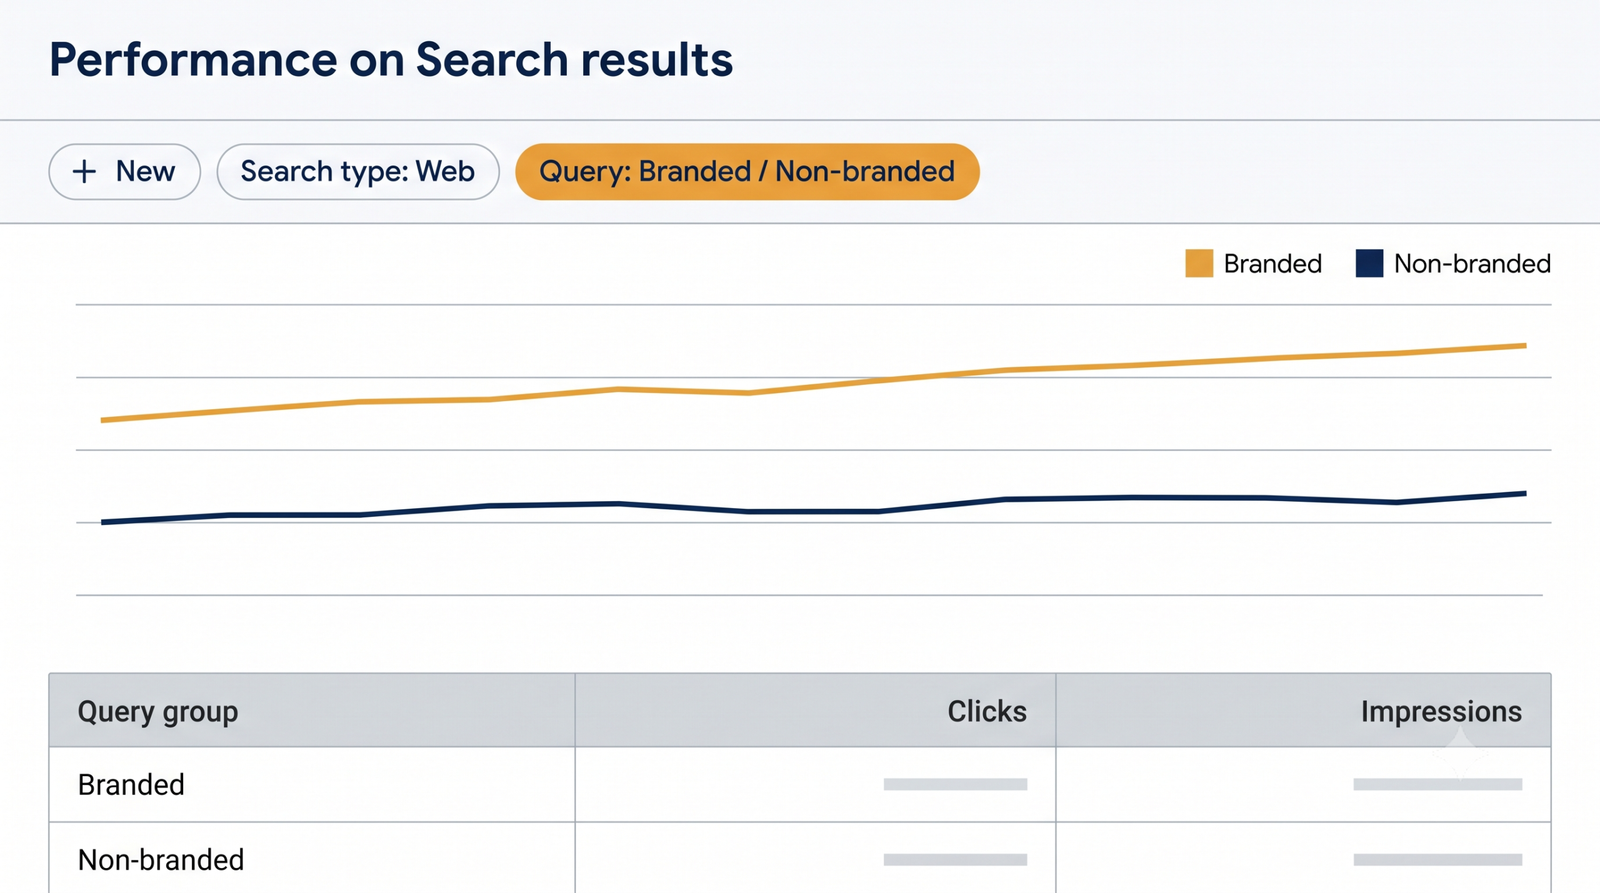
The gap between the two lines is the number worth talking about.
Then watch what happens.
Verdant’s blended organic clicks were up 8% year over year, which looks fine. Split apart, branded was up 31% — the client had run a trade show campaign — and non-branded was down 4%.
Blended, that’s a good month. Split, it’s a problem to solve.
The split version is the one that keeps the client three years instead of eleven months.
5. Lead With an Executive Summary
The first page of the report is the only page you can be certain gets read.
Write it last. Put it first.
Four short paragraphs, in this order:
- The headline number, stated against the commitment, not against last month
- What changed and why, in one or two sentences of plain language
- What we did, condensed to the three or four items that mattered
- What we’re doing next, with a specific timeframe
No jargon. If a sentence contains “topical authority,” “crawl budget,” or “E-E-A-T,” rewrite it for someone who has never read an SEO blog.
Here’s the Verdant summary for a normal month:
Non-branded organic clicks are up 22% year over year, tracking ahead of the 40% annual target. Growth came mainly from the commercial mower category pages, which moved from page two to positions four through seven after the September content update. This month we rewrote 14 product descriptions, fixed the canonical errors on the parts catalogue, and earned two links from trade publications. Next month we’re targeting the irrigation category, where the same page-two pattern exists.
Ninety seconds of reading. The CFO now knows what he’s buying.
Tip
Read your executive summary out loud before sending it. If you stumble over a sentence, the client will too.
6. Attach a Recommendation to Every Number
A number without a recommendation is trivia.
This is the discipline that separates a report from a data export, and it’s simple to apply: every chart in the document gets one line underneath it saying what the client should do about it.
Not every metric needs action. Some warrant “no action, monitoring.” That’s a legitimate recommendation and you should write it explicitly, because the alternative is the client inventing their own interpretation.
Three examples from the Verdant report:
- CTR on the mower category is 1.4% at position 6. Recommendation: rewrite three title tags this month, retest in 30 days.
- AI presence rate rose from 12% to 19%. Recommendation: no action — the FAQ blocks added in August are working, so we’ll extend the pattern to irrigation pages.
- Two 404s appeared on high-traffic product URLs. Recommendation: your dev team needs to restore or redirect these; we’ve sent the list separately.
Notice the third one assigns work to the client. Do that explicitly and in writing. It documents dependencies, and when the fix doesn’t happen, the report is the record of when you flagged it.
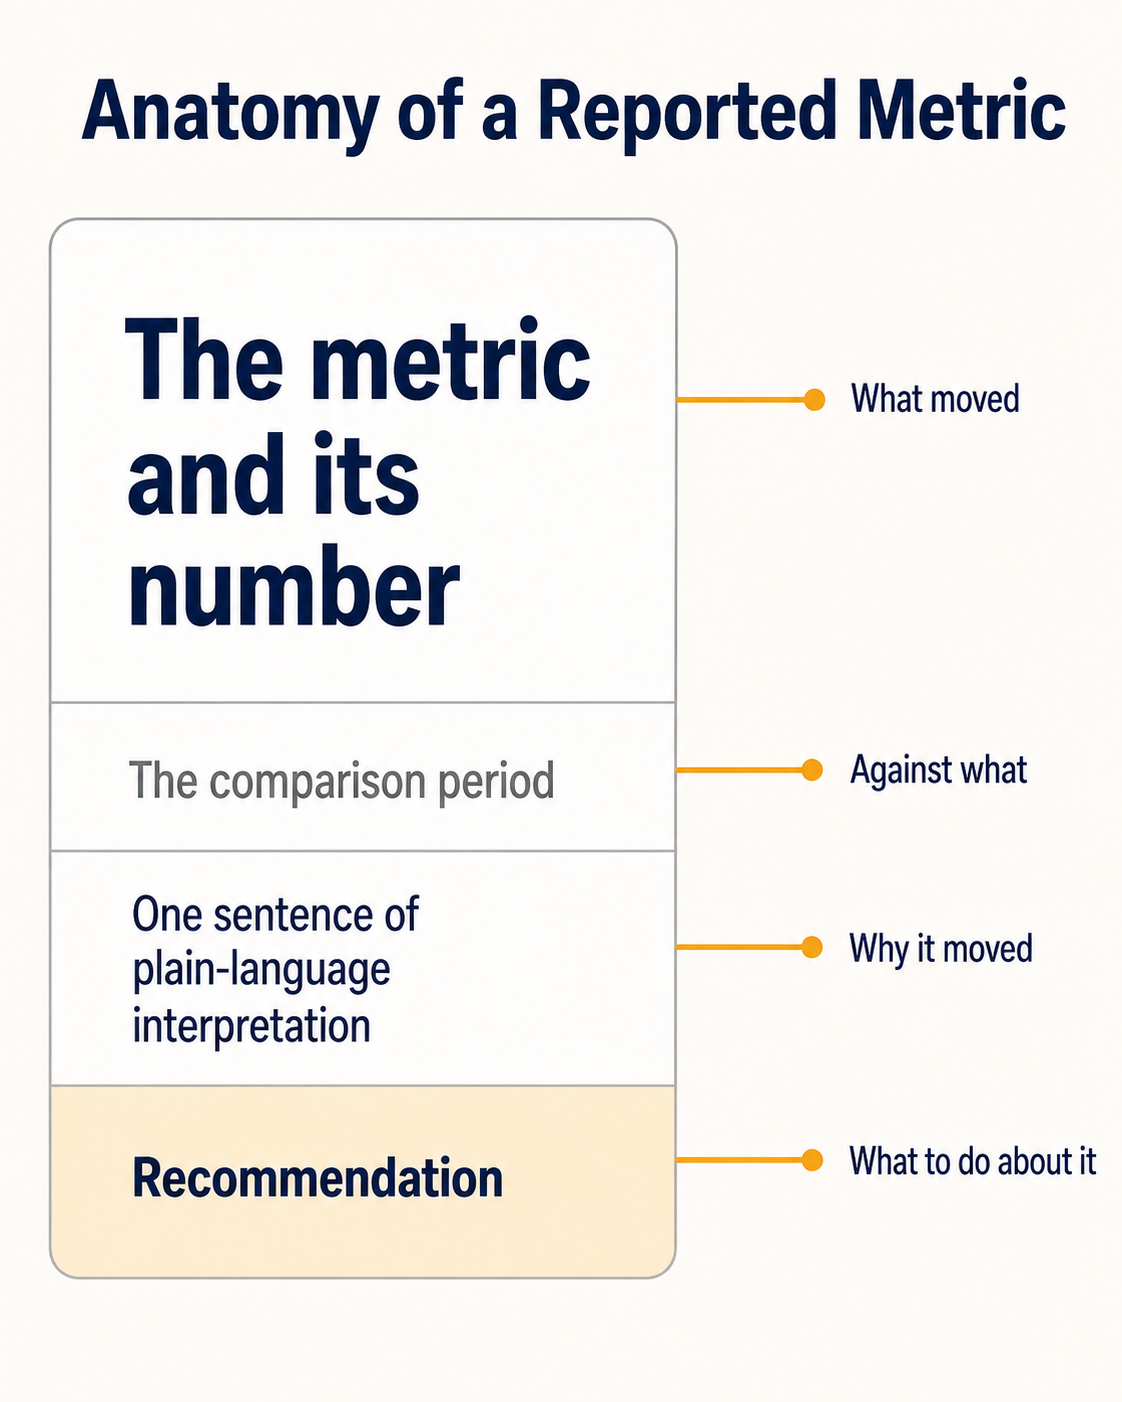
Every metric in the report should survive that structure. If one can’t, cut it.
7. Report the Bad Months Properly
Every guide says be transparent. Almost none says how.
Here’s the protocol.
Lead with it. The bad news goes in the executive summary, in the first paragraph, in plain language. Burying a 30% traffic drop on page seven is the fastest way to lose a client, because they will find it, and then they’ll wonder what else you buried.
Name the cause, or say you don’t know yet. “Traffic fell 18% following the March core update; we’re still isolating which page types were affected” is a professional sentence. “Traffic fell 18% due to algorithmic volatility” is a non-answer, and clients can tell.
Separate what you control from what you don’t. A core update, a competitor’s acquisition, a client-side site migration that happened without telling you — these are context, not excuses, and the difference is whether you also state what you’re doing about it.
Show the correction with a date. Not “we’re investigating.” Instead: “we’ll have the affected page list by the 14th and a remediation plan by the 21st.”
Restate the commitment and whether it’s still achievable. If the annual target is now unrealistic, say so in the month you know, not in month eleven.
Verdant had one of these. A Shopify theme change removed the H1 from every product page, and organic clicks fell 23% over six weeks before anyone caught it.
The report led with it, named the cause, noted that the theme change happened client-side without notice, and set a fix date. The client renewed.
Note
The instinct to soften a bad month with extra charts is strong and wrong. More data around bad news reads as distraction. Fewer, clearer numbers read as confidence.
A Report Structure You Can Reuse
Same skeleton every month. Familiarity is a feature — the client learns where to look, and the report gets faster to produce.
Six sections:
- Cover: client name, reporting period, one-line report title
- Executive summary: the four paragraphs from Step 5
- Performance against commitment: the headline chart, year over year
- Metric sections: the nine metrics, each with a recommendation
- Work completed and work planned: what you did, what’s next, what needs the client
- Appendix: backlinks, Core Web Vitals, full keyword tables, raw exports
The appendix matters more than it seems. It gives the detail-oriented client somewhere to go without cluttering page one for the CFO. Two audiences, one document, no compromise.
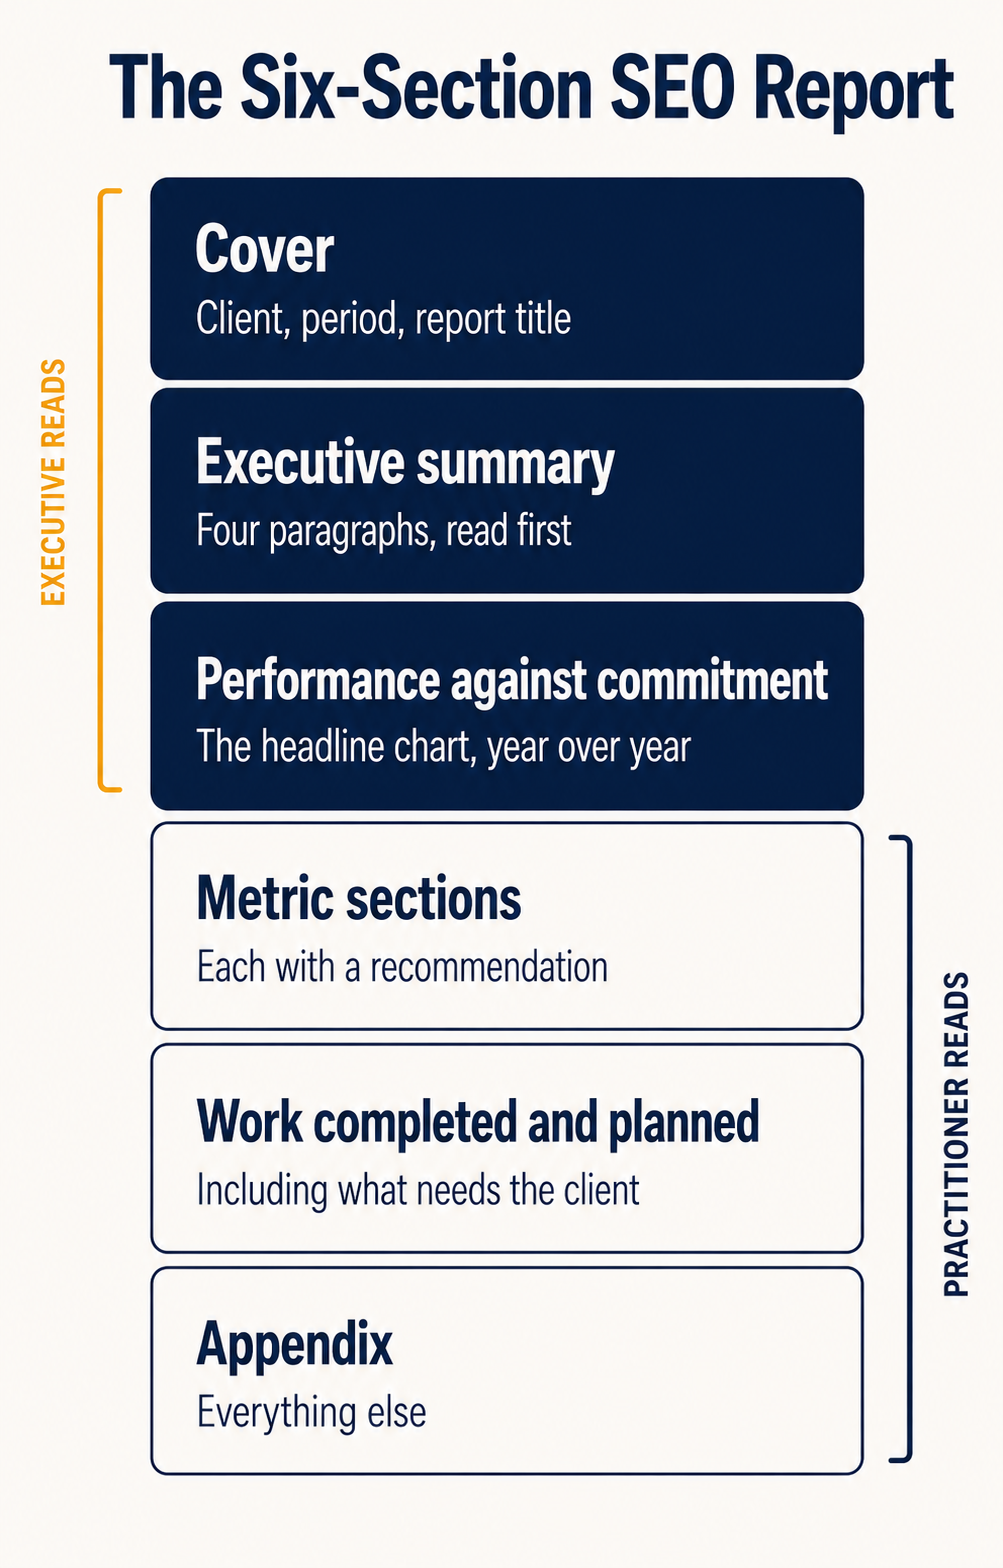
Note which bands the executive actually reads. Design for that.
Mistakes That Cost You the Client
Four patterns show up repeatedly in reports that precede a cancellation.
Reporting activity instead of outcomes. “We published 8 blog posts and built 14 links” describes effort. Clients don’t buy effort. Pair every activity line with the result it produced, or move it to the appendix.
Sending the report without a conversation. A PDF in an inbox has no chance to answer a question. A fifteen-minute call each month, or even a two-minute video walkthrough, does more for retention than another chart.
Changing the format every month. Each redesign forces the client to relearn the document. Pick a structure and hold it for at least six months.
Going silent when results are bad. The month you least want to send a report is the month it matters most. Reports that arrive late during bad quarters tell the client exactly what you’re feeling.
SEO Report FAQs
How often should you send SEO reports to clients?
Monthly is the right default. SEO moves slowly enough that weekly reports show noise, and quarterly leaves clients wondering what they’re paying for between updates.
Add a quarterly review on top — a longer session covering strategy, competitive position, and whether the annual commitment still holds.
Weekly reporting makes sense only during an active crisis: a migration, a manual action, a traffic collapse under investigation.
What should an SEO report include?
At minimum: an executive summary, performance against an agreed commitment, non-branded organic traffic, organic conversions, target keyword movement, CTR by page, and a list of work completed and planned.
In 2026, add AI visibility — how often the brand appears in AI-generated answers, and which pages get cited.
Everything else belongs in an appendix.
How long should an SEO report be?
Page one should be readable in ninety seconds. The main body runs three to six pages. The appendix can be as long as the data requires, because nobody is obliged to read it.
Length is not the measure of value. A client who reads four pages fully got more than one who skimmed twenty.
Should you use an SEO reporting tool or build reports manually?
Use a tool for data assembly — pulling, refreshing, and charting. That work is repetitive and automation does it better.
Write the interpretation yourself. The executive summary and the recommendations are the parts the client is actually paying for, and no template generates them.
The right split is automated data, human analysis.
What to Do Before Your Next Report
There’s a lot of structure described above, and you don’t need to implement it all at once.
Start with one change: split branded from non-branded traffic, and make non-branded your headline number.
It takes ten minutes in Search Console, it will probably make this month’s figures look worse, and it is the single fastest way to turn a report the client tolerates into one they trust.
Then add the executive summary next month, and the recommendation lines the month after.